9.176
Unterstützende
8.487
in Schweiz
Petent hat die Petition nicht eingereicht/übergeben.
Zeitlicher Verlauf
9.176
Unterschriften insgesamt
8.487
Unterschriften aus Schweiz
6
Unterschriften pro Tag im Durchschnitt
29.04.2020
Unterschriftenstärkster Tag der Petition
Verbundenheit zum Thema. Was trifft am ehesten zu?
33%
sind selber direkt betroffen
30%
fühlen sich verantwortlich
30%
helfen, das Anliegen zu verbreiten
23%
versuchen andere von dem Anliegen zu überzeugen
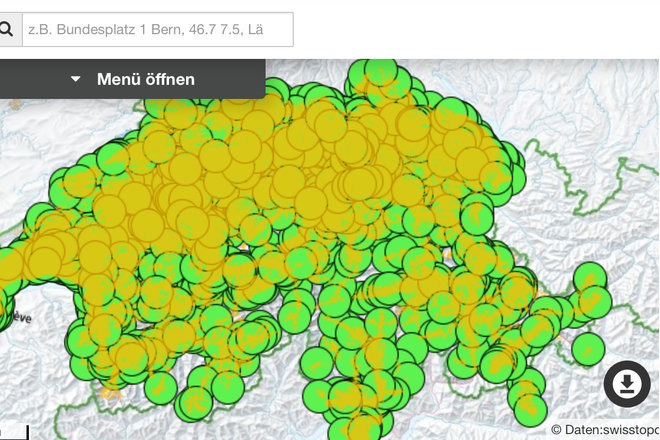
Geografische Verteilung der Unterschriften
1%
kommen aus Kreis 9
5%
kommen aus Zürich
2%
kommen aus Verwaltungsregion Oberland
5%
kommen aus Verwaltungskreis Bern-Mittelland
nach Land
| Schweiz | 8.470 |
| Deutschland | 498 |
| Österreich | 69 |
| Frankreich | 49 |
| Belgien | 11 |
| Liechtenstein | 9 |
| Spanien | 7 |
| Italien | 6 |
| Ungarn | 5 |
| Niederlande | 5 |
nach Bundesland
| Kanton Zürich | 1.719 |
| Kanton Bern | 1.230 |
| Aargau | 736 |
| Kanton St. Gallen | 728 |
| Kanton Luzern | 476 |
| Kanton Basel-Landschaft | 392 |
| Kanton Graubünden | 373 |
| Kanton Thurgau | 370 |
| Kanton Solothurn | 367 |
| Kanton Basel-Stadt | 241 |
nach Landkreis/Kreisfreie Stadt/Region/Stadtbezirk
Hinweis zu Dopplungen: Unterschriften können in dieser Liste zu verschiedenen Verwaltungsebenen gezählt werden.
| Verwaltungskreis Bern-Mittelland | 482 |
| Bezirk Zürich | 424 |
| Zürich | 424 |
| Verwaltungskreis Thun | 226 |
| Verwaltungsregion Oberland | 226 |
| Basel | 216 |
| Bezirk Arlesheim | 195 |
| Bezirk Winterthur | 191 |
| Bezirk Hinwil | 187 |
| Bezirk Meilen | 177 |
